How Crash Data Works?
First of all, let’s define how exactly crash data works and how the statistics are being formed. Crash data collection and analysis play a crucial role in understanding and addressing road safety issues.
Crash Reporting
When a motor vehicle accident happens, individuals involved in the crash or witnesses are generally obligated to notify the appropriate law enforcement agencies or authorities, such as local law enforcement. The process of reporting involves providing essential information about the accident, including its location, date, time, vehicles involved, injuries sustained, and potential factors that may have contributed to the incident.
Data Collection
Law enforcement officers and other designated personnel gather the necessary information at the crash scene. They may conduct interviews, examine the vehicles and road conditions, take photographs, and collect witness statements. This on-scene data collection aims to capture as much relevant information as possible.
Data Entry and Documentation
The collected crash data is then entered into databases or software systems specifically designed for crash reporting. This information includes a wide range of variables, such as vehicle types, driver characteristics, crash severity, weather conditions, road features, and contributing factors like speeding or distracted driving.
Data Analysis
Once the crash data is collected and documented, it can be analyzed to identify patterns, trends, and contributing factors to understand the causes of accidents. This analysis often involves using statistical methods and data visualization techniques to extract meaningful insights. It helps identify high-risk areas, common crash types, and factors that contribute to accidents.
Safety Planning and Interventions
The findings obtained from analyzing crash data are subsequently employed to create focused safety plans and interventions. This information is utilized by transportation agencies, policymakers, and law enforcement to allocate resources effectively, enhance road infrastructure, improve driver education, implement enforcement strategies, and increase awareness regarding specific safety concerns.
Monitoring and Evaluation
Crash data collection and analysis are ongoing processes. Regular monitoring and evaluation of crash trends and the effectiveness of safety measures help measure progress, identify emerging issues, and adjust strategies as needed. By continually analyzing crash data, authorities can track the impact of interventions and make data-driven decisions to enhance road safety.
It’s worth noting that crash data collection and analysis methods can vary among jurisdictions and organizations. However, the fundamental purpose remains the same: to gather and analyze information about crashes in order to enhance road safety and reduce the frequency and severity of accidents.
The Main Causes of Car Accidents in Portland
Portland, Oregon, like many urban areas, faces various car accident issues. Some of the common concerns and challenges related to car accidents in Portland include
- Traffic congestion. Portland experiences heavy traffic congestion, especially during peak hours, which can contribute to an increased risk of accidents. Congested roads often lead to frustration, aggressive driving, and a higher probability of rear-end collisions;
- Bicycle and pedestrian accidents. Portland has gained recognition for its infrastructure that promotes cycling and its substantial pedestrian population. Nevertheless, the coexistence of vehicles, cyclists, and pedestrians can give rise to accidents, particularly when there is insufficient awareness or disregard for traffic regulations;
- Distracted driving. Distracted driving, including texting, engaging in phone conversations, or utilizing electronic devices while operating a vehicle, poses a significant risk on the roads of Portland. These distractions divert attention from the task of driving and can result in accidents;
- Impaired driving. Operating a vehicle while impaired by alcohol or drugs remains a concern in Portland. Impaired drivers pose a serious threat to themselves and others on the road, increasing the likelihood of accidents and fatalities;
- Road infrastructure challenges. Similar to numerous urban areas, Portland possesses aging road infrastructure that might require maintenance or upgrades. Substandard road conditions, insufficient signage, or outdated intersections can all be contributing factors to accidents;
- Weather-related accidents. In the Pacific Northwest region, the prevalence of wet and rainy weather can result in slippery road conditions and diminished visibility. These weather-related factors heighten the risk of accidents, especially when drivers fail to adapt their driving behavior accordingly;
- Inadequate public transportation options. Insufficient public transportation options may lead to more vehicles on the road, contributing to congestion and an increased probability of accidents;
- Reckless driving. This encompasses aggressive driving behaviors such as tailgating, frequent lane changes, disregarding traffic rules, running red lights or stop signs, and other similar actions;
- Vehicle defects. Mechanical failures, such as faulty brakes, tire blowouts, or steering malfunctions, can contribute to accidents.
In order to tackle these concerns and enhance road safety, the Portland Bureau of Transportation (PBOT) and other local authorities in Portland engage in various initiatives encompassing education, enforcement, infrastructure enhancements, and public awareness campaigns.
Portland Oregon Car Accident Reports
Let’s take a look at some general statistics of Portland car accidents and some facts regarding crash fatalities. According to Portland Police Bureau, the number of deaths and injuries in the period of 2017-2019 is the following.
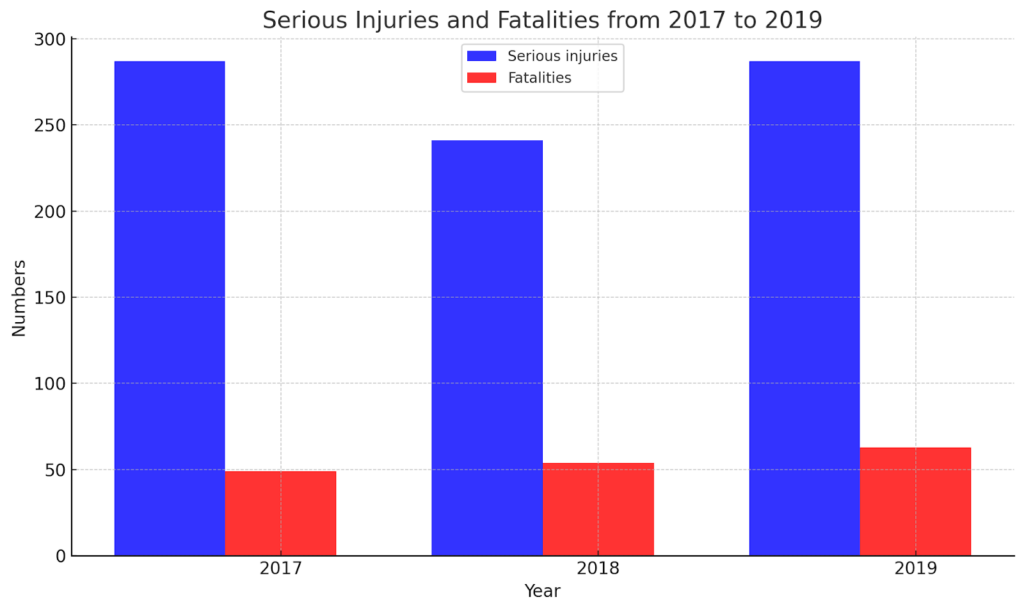
Here is the bar graph depicting the number of serious injuries and fatalities from 2017 to 2019. The data clearly shows the trends for each year.
Some of the other trends in Portland car accidents are
- During the year 2021, a significant 60% of traffic fatalities took place on Portland’s High Crash Network, which constitutes only 8% of the city’s streets but is responsible for the majority of deadly accidents. This trend aligns with the data observed from 2017 to 2020, where an average of 60% of fatal crashes occurred on the High Crash Network. The percentage range during that period fluctuated between 55% and 67%;
- The year 2021 witnessed pedestrians accounting for 43% of all traffic fatalities, slightly surpassing the average of 38% observed during the period from 2017 to 2020. Also, there was a notable increase in the number of pedestrian fatalities, with an annual average of 17 deaths between 2017 and 2020 compared to 27 deaths in 2021;
- During the period spanning from 2017 to 2020, there were a cumulative of 10 cyclist fatalities, with the yearly figures varying from 1 to 5. However, in the year 2021, there were no recorded fatalities attributed to bicycling in Portland;
- Nineteen out of twenty-seven pedestrian fatalities, which accounts for seventy percent, were individuals from the houseless community. Similarly, twenty-one out of sixty-three total traffic deaths, which corresponds to thirty-three percent, were houseless community members. The housing status of victims has not been previously monitored by PBOT, but these figures from 2021 are particularly noteworthy, indicating a concerning trend that will be closely monitored in the future;
- The number of fatalities resulting from hit-and-run incidents witnessed a significant increase, more than doubling the average from 6.3 to 14 deaths in 2021. Remarkably, nearly all of these tragic incidents, specifically 13 out of 14, involved pedestrians losing their lives.
Portland is not the only city experiencing a significant rise in traffic fatalities during 2021. While comprehensive year-end statistics are not yet available, national data reveals an alarming 18.4% increase in traffic deaths during the first half of 2021 when compared to the same period in 2020. These figures indicate the highest number of traffic fatalities recorded in the first half of a year since 2006.
Summing Up
Portland, being the largest city in Oregon, faces its share of car accidents, influenced by factors like weather conditions, road infrastructure, and driver behavior. Crash data collection and analysis are essential for understanding all these road safety issues. Analysis of this data helps identify patterns and contributing factors, leading to safety planning and interventions. Portland’s main causes of accidents include traffic congestion, bicycle, and pedestrian accidents, distracted and impaired driving, road infrastructure challenges, weather-related accidents, inadequate public transportation options, and reckless driving. Specific statistics indicate high traffic fatalities in 2021, with pedestrians and houseless community members being particularly vulnerable. In general in the last few years there has been a huge increase in the number of car accidents.